
I’ve already gone on and on about how this year, 2020, the strangest year EVER, has passed the halfway point. I like to check in on my reading numbers at the end of each quarter, not to push myself to read more but because I’m genuinely interested in the data. You might not know this, but I am a true lover of spreadsheets and finally began tracking my reading in Google Sheets last year, so now I have a beautiful spreadsheet full of all sorts of goodies!
If you’ve been around a while, you’ll know that I track my books in three ways: Goodreads, a paper/pen notebook in my Travelers Notebook, and in Google Sheets. It sounds inefficient, but it’s been really helpful to use all three.

I like Goodreads for the social aspect and the yearly challenge, but their end of year wrap-up doesn’t provide near enough data for my numbers loving heart. Also, I like to check in on the data as I go along and dislike waiting until the end of the year.
I like my paper and pen because it’s often easier to jot down titles as I start them, rather than waiting for the computer to boot up to log them into a spreadsheet or update Goodreads. Plus, I love seeing my little notebook fill up each year and it’s easy to just flip through the book when I’m trying to write a booklist for a blog post. But I was trying to keep track of a LOT in that tiny notebook. It became chaotic and messy, which is a trigger for me. I knew I needed a different solution.
Enter Google Sheets. With this (free) program, I can create pivot tables that do all of the calculations for me. It’s so simple to just add columns for new data that you want to track. I figured out how to embed Google Sheets into my website and it automatically updates any changes – you can find it on my 2020 Reading page at any time! It’s not very user friendly on cell phones, but it gets the job done.
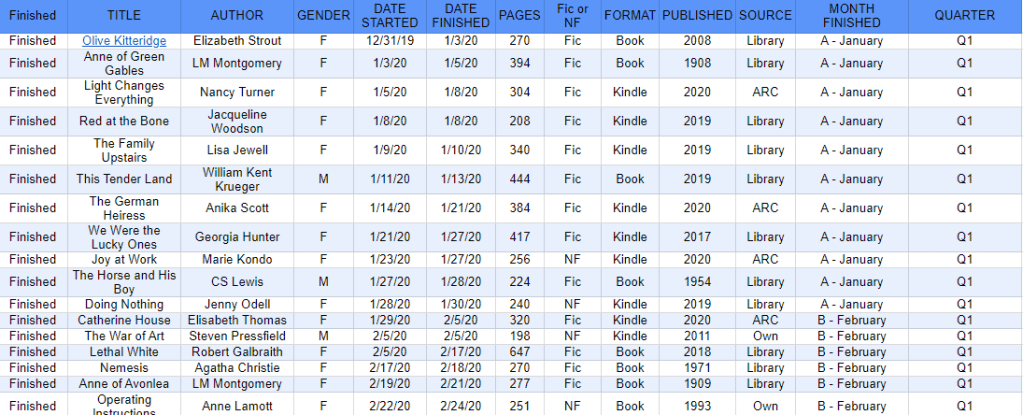
I’ve made a small change to the spreadsheet since my last quarterly update and added a column to track the quarter I finished the book. I knew that I’ve read a lot more of my own books and more audiobooks this quarter and wanted to know exactly how those numbers have changed. It was pretty easy tweak with Google sheets!

From the graphic above, you can see that I’ve attempted 59 books this year. I’ve finished 53, abandoned 4, and am currently reading 2. In the first quarter, I attempted 25 books. In the second quarter, I attempted 34. I abandoned more books in the second quarter, but I also finished more (3 and 29, respectively).
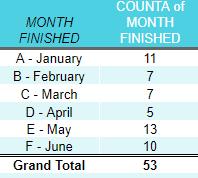
This is a new pivot table that I created this quarter. I wanted to see how my reading fluctuated by month. April was the month that I finished the fewest books (5) and I finished the most in May (13).

I really like this simple chart because I want to ensure that I’m using the library more than buying my own books. And I am! When combining both quarters, I’ve read 18 of my own books, borrowed 31 from the library, and read 4 advanced reader copies from Netgalley.

I was finally able to combine three charts into one and I think this is somewhat readable. I always feel so accomplished when I can figure these things out. This chart looks at the format of the book (audio, physical book, and kindle) by source (ARC, library, and own) and quarter. Sounds complicated, I know. (This is why I love pivot tables!) I’ll break it down a bit:
Audio: I finished zero audiobooks in the first quarter and 14 in the second quarter. 8 of those audiobooks were from the library and I used 6 Audible credits.
Physical books: I finished 15 physical books in the first quarter and 3 in the second. When combining the quarters, 15 were from the library and 3 were off of my own shelves.
Kindle editions: I finished 9 Kindle books in the first quarter and 12 in the second. 4 of the Kindle editions were Advanced Review Copies (all in the first quarter), 8 were from the library, and I own 9 of them.

This chart shows the gender of the author and whether the book was fiction or not. I’ve read 44 books by women and 9 books by men. I’ve read 41 books that were fiction and 12 that were nonfiction.
Women: 36 were fiction and 8 were nonfiction.
Men: 5 were fiction and 4 were nonfiction.
My goal is to not only read more books by women, but more nonfiction books by women as well. And I’m still doing that!

This pivot table just adds up some interesting tidbits. I’ve finished 53 books. I’ve read a total of 16,545 pages. The longest book I’ve read was 647 (Lethal White) and the shortest was 97 (84, Charing Cross Road). The average number of pages per book was 312.

I think this is my favorite chart. It breaks down publication year by quarter. It’s much more spread out than last year’s chart because I’m working my way through a few series. Last year I read a ton of the current year’s publications thanks to the New Arrivals shelf at the library. This year I’m spending a lot of time with backlists, which has been fun. So far this year, I’ve only read 8 books published in 2020 and 11 books published in 2019. The oldest book I’ve read was published in 1908 (Anne of Green Gables).
I have to admit that I have so much fun writing these posts. I love playing with the pivot tables to see see how can I display the data in ways that give me new information. I know a lot of people track other variables about authors, such as the number of authors who identify as BIPOC (black or indigenous people of color) or LGBTQ+ (lesbian, gay, binary, trans, queer, +). I’ve hesitated doing that because I’m not sure if I even know those things all of the time. It would require a bit more research into authors than I currently do and I’m not sure that I’d like the numbers I see on my spreadsheet. Which, of course, is all the more reason to do it – so that I can track and improve those numbers. So here’s my vow: by the next quarterly update (the end of September), I will update my spreadsheet to include those numbers.
I’m planning to be back tomorrow for an Unraveled post. I hope you have a great Tuesday!


Wow, Katie – you are a star! You’ve made me want to explore Google Docs more – and maybe eventually abandon Excel…yikes!! And you’re reading, with three little ones at home, just blows me away. You go girl!!
LikeLiked by 1 person
You’re so kind, Jordy! It took me a while to discover that Google Sheets had pivot tables but was thrilled when I figured it out. And it seems like Google is always updating, which is awesome because it’s all free – no need to spend hundreds of dollars on a new version!
LikeLike
OMG, I mean YOUR reading!!
LikeLiked by 1 person
This is seriously impressive! I’m always interested in my stats, but I don’t know how to do all the pivot table stuff to go into this level of detail!
LikeLiked by 1 person
Thanks Sarah! I took a course on pivot tables at my old job before I left. It has changed my life, ha!
LikeLike
My goodness you love your numbers. I keep records of what I read- on my blog , and annual list in page, and a monthly review. I also have handwritten book- but i do that alphabetically, so i can see which authors I have read. I’ll show it in my July book review- I liked your little video.
LikeLiked by 1 person
I can’t wait to see your list!!
LikeLike
What fun! I think I need to try some new tracking methods now that I am retired and might have time to keep it up. Thanks for the inspirational
LikeLiked by 1 person
Thanks Juliann! I can’t wait to see what you come up with 🙂
LikeLike
First – what a great YEAR of reading you’ve had! managing a family, three kiddos, quarantine AND all those books is a fantastic accomplishment! I spent a couple of years tracking data on a spreadsheet to see what I was reading (including author traits like gender, BIPOC, country) and then to see if I could improve. I actually set out 2020 intending to read only female authors (except for a couple of bookclubs) and made the decision in May to expand that to include recommendations by BIPOC. Bookstagram has been a wonderfully diverse source of recommendations!
LikeLiked by 1 person
Thanks Mary! I love your 2020 reading goal of reading only women and recs from BIPOC. That is so much fun. I hadn’t thought to track the country of the author. I think I might try that to ensure that I’m not totally US-centric (which, of course, I’m not. I might read more UK authors than anything else, but won’t know until I track it). Thanks for this idea!
LikeLike
Very cool! I am not really attracted to Spreadsheets but I’m glad there’s an alternative to Excel that’s easy to use! I do love fiddling with my stats, though, and “cataloging” my reading on Goodreads and my journal.
LikeLiked by 1 person
It’s all so much fun, no matter which program you use!
LikeLiked by 1 person
Ohh wow, this is AMAZING. Makes my data loving heart so happy 😀
LikeLiked by 1 person
YEES! Mine, too 🙂
LikeLiked by 1 person